eVTOL Crashes Give You Almost No Room to Absorb Impact. A New CFRP Tube Cross-Section Is Designed for Exactly That
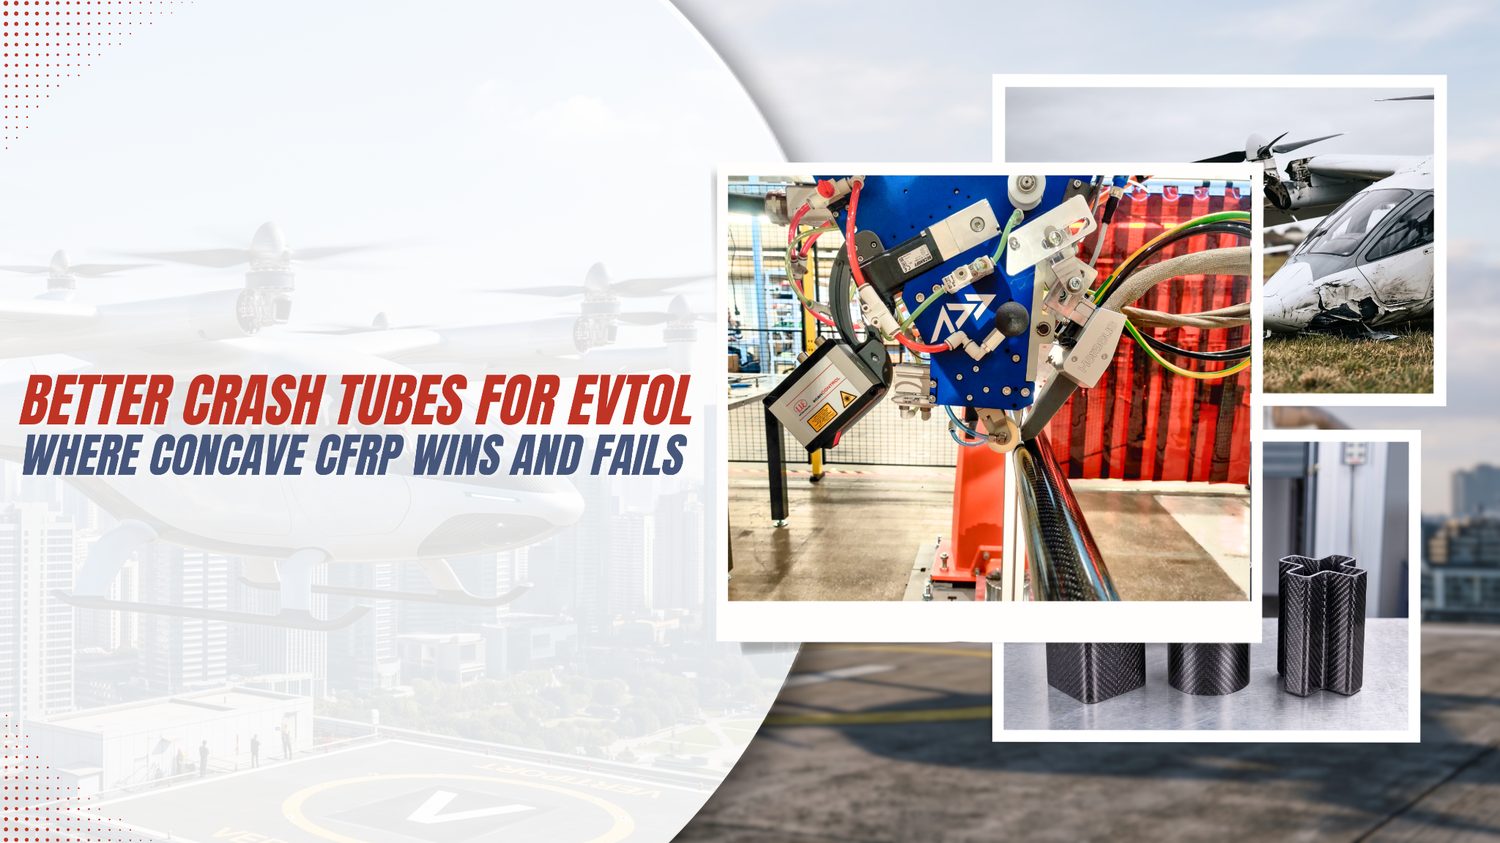
An electric air taxi has almost no structure beneath the cabin floor to soak up a hard landing. A 2025 open-access study asks whether the shape of the crush tubes packed into that shallow space can be redesigned to do more work per gram — and finds a concave CFRP profile that wins big on a straight-down hit, then loses its footing the moment the impact comes in at an angle.
An electric air taxi has a problem that a regional jet does not. When something goes wrong close to the ground, there is barely any structure beneath the cabin floor to soak up the hit. The space is shallow, the vehicle is deliberately light, and it cannot glide down on a dead motor the way a fixed-wing aircraft can. A 2025 open-access study in Defence Technology takes that specific constraint and asks a pointed question: if the energy-absorbing zone is this small, can the shape of the crush tubes packed inside it be redesigned to do more work per gram?
The answer the authors arrive at is a family of concave polygonal carbon fibre reinforced plastic (CFRP) tubes, tested against the regular polygonal and circular tubes that crashworthiness engineers normally reach for. What makes the paper worth a careful read is that it does not stop at the flattering result. It finds a genuine weakness in the concave design and then spends the back half of the study closing that gap.
Below is a walkthrough of what the researchers did, what the numbers actually say, and where this lands for anyone placing fibre on eVTOL crash structures today.
A note on sourcing. Everything attributed to “the paper,” “the authors,” or “the study” comes from Fu, Liu, Liu and Zhang (2025), cited in full at the end. Sections marked “Our perspective” are Addcomposites' own commentary and are not claims made by the authors. No figures from the paper are reproduced here; the article is licensed CC BY-NC-ND 4.0, which does not permit commercial reuse or adaptation of its figures, so all diagrams below are our own schematic renderings of the paper's reported data.
Why eVTOL subfloors are their own category of problem
The study opens by lining eVTOL aircraft up against fixed-wing aircraft and helicopters across a set of design attributes. The contrast is stark, and it is the whole reason the research exists. According to the authors' comparison, eVTOL platforms sit at the demanding end of nearly every relevant axis: they carry the strictest lightweight requirement, the highest reliance on composite material, the smallest bottom energy-absorption space, and the weakest ability to perform an unpowered landing. On top of that, formal safety design standards for the category are described as minimal compared with the extensive standards that govern conventional aircraft.
The Design-Constraint Comparison
eVTOL sits at the demanding end of nearly every axis — per the authors' comparison, Fu et al. (2025)
Diagram above: original visualization by Addcomposites of the design-constraint comparison reported in Fu et al. (2025).
The authors also describe the crash sequence itself. In a fixed-wing aircraft, the impact is bled off as the underfloor tubes and the lower skin panels give way in sequence. An eVTOL behaves differently: the gear crumples first, whatever energy is left flows up into the subfloor, and the seats take what remains. Because the operating environment is low, cluttered, and prone to wind and electromagnetic disturbance, the paper argues that off-axis and oblique impacts are not edge cases for these vehicles. They are a design centre.

An eVTOL after an off-axis landing, damage concentrated on the underfloor region that must absorb the impact. Illustrative render, not an actual crash.
That framing matters, because it justifies the study's most important choice: testing tubes not only straight-on but at an angle.
The design idea: adding corners, then hollowing them inward
Thin-walled tubes soak up a crash by crumpling in a controlled way instead of failing all at once. In metals, there is a long-established trick: give the cross-section more corners and it absorbs more energy, because every fold at a corner does extra work. The paper's premise is to borrow that corner-count logic and test whether it carries over to CFRP, where the failure physics are very different from bending metal.
The researchers built two families of shapes, every profile drawn to a fixed 225 mm perimeter — which pins the weight down and makes the shape-versus-shape comparison honest:
- Regular polygons (the “P” series): square (P4), octagon (P8), and dodecagon (P12) — a progression from four corners toward a near-circular profile.
- Concave polygons (the “M” series): M8 and M12 — cross-sections with an equivalent corner count to their regular counterparts, but with sides that fold inward to create a re-entrant, cruciform-like profile.
(A small labelling quirk in the paper: it says the letters “P” and “C” stand for regular and concave shapes, then names the concave tubes M8 and M12 rather than C8/C12. We use the labels the paper actually applies to the tubes — M8 and M12.)
Every tube had its corners rounded to 5 mm so the plies could wrap without kinking, a 2 mm wall built from nine plies, and the same overall perimeter to hold mass constant across the comparison.
TUBE GEOMETRY
The Cross-Section Family
Five profiles, one fixed perimeter — regular polygons vs. concave re-entrant shapes
Regular “P” series — convex, corners added
Concave “M” series — re-entrant, sides fold inward
Diagram above: original visualization by Addcomposites of the P-series and M-series cross-section family reported in Fu et al. (2025).
Each tube was then loaded three ways: straight down at 0°, and obliquely at 7.5° and 15°. The small oblique angles were a deliberate choice. As the authors see it, when a hit comes in at a sharp angle the gear and airframe absorb the brunt, so the subfloor is rarely tested at those extremes — its real job is to perform across a band of modest off-axis angles.
Loading Conditions Tested
Every tube crushed three ways: straight-down, and obliquely at two small angles
The small oblique angles are deliberate — off-axis and oblique impacts are the eVTOL subfloor's real design centre, not an edge case.
Diagram above: original visualization by Addcomposites of the three loading conditions tested in Fu et al. (2025).
How the authors measured “good”
Three metrics carry the analysis, and it is worth keeping them straight because they can pull in different directions:
- SEA — specific energy absorption (J/g). Energy absorbed per unit of crushed mass. Higher is better. Because it is normalised by mass, the authors note it lets axial and oblique results be compared on the same footing.
- PCF — peak crushing force (kN). The single highest force spike during crushing. This one is tied directly to occupant survival: a force spike that is too high is what injures the people inside, so lower is generally safer here.
- CFE — crushing force efficiency (%). The average crushing force divided by the peak, expressed as a percentage. It measures how steady and controlled the collapse is. A high CFE means the tube crushes smoothly rather than spiking and then sagging.
The experiments: square, circular, and crisscross tubes
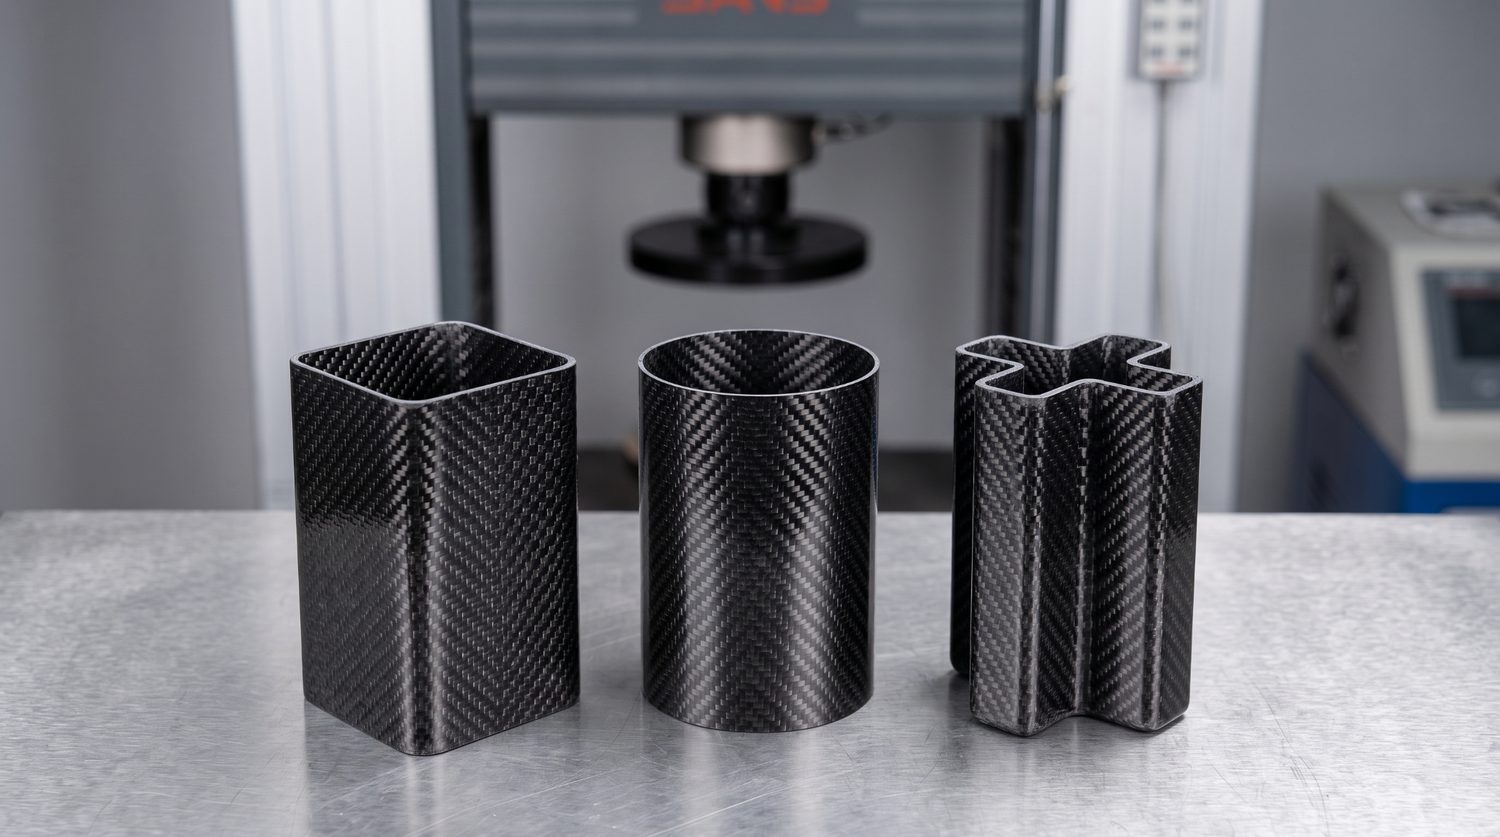
Square, circular, and crisscross CFRP tube specimens staged for axial crush testing, where cross-sectional shape is the central variable. Illustrative render, not the paper's specimens.
Before running simulations across the full shape family, the team validated their approach with physical crush tests. Specimens were laid up from 3K plain-weave carbon/epoxy prepreg and consolidated by bladder moulding, with the cure run at 150°C and 1.25 MPa of internal pressure. The finished tubes were then crushed over a 35 mm stroke on a 200 kN machine. Three specimens were run per test for repeatability, on a flat platen for axial loading and on a platen tilted to 15° for oblique loading.
The physical results already told the central story of the whole paper. Under axial load, the crisscross tube (a concave cruciform profile) came out on top, absorbing roughly 18% and 16% more energy per gram than the square and circular tubes. Under oblique load, the same crisscross tube collapsed to the bottom of the pack.
PHYSICAL CRUSH TESTS
Experimental SEA: Axial vs. Oblique
Specific energy absorption (J/g) — the crisscross tube wins big straight-down, then falls hardest off-axis
Square
Circular
Crisscross
104.3 J/g ← best axial in the set
53.67 J/g ← worst oblique in the set (−23% vs. the square tube’s own oblique figure; ~49% below its own axial value)
Source: Table 3, Fu et al. (2025)
Source: Table 3, Fu et al. (2025). Diagram above: original visualization by Addcomposites.
Under axial load, every tube crushed the controlled way, each wall peeling outward into curling petals of laminate. The circular and crisscross profiles produced more of these splits than the square, so more of the material was consumed in the crush and more energy went with it. Under oblique load, the picture changed. The square and circular tubes settled into a stable mix of peeling and bending. The crisscross tube crushed cleanly at first, but around the 20 mm mark it lost the plot, folding sideways instead of continuing to crush, its walls left largely intact. That instability dragged it down to 53.67 J/g — about 23% below the plain square tube's oblique figure, and roughly half its own axial value.
There is a plain lesson buried in the crushing-force efficiency numbers too. The crisscross led on axial CFE at 79.58% — a very clean, steady axial collapse — but fell to 54.8% once the load came in off-axis. The circular tube ran the reverse: a weak 48.01% axially that strengthened to 71.29% under the oblique load. Shape does not just set how much energy a tube absorbs; it sets how gracefully the tube behaves when the load direction is not what you designed for.
Building a model you can trust
To explore shapes beyond what they could mould and crush by hand, the authors built finite element models in LS-DYNA 13.0 using the Mat 54 material model with a two-way fibre failure criterion (a modified Chang-Chang formulation). A recurring headache with composite crush simulation is that stacked-shell models get slow when you add layers, and odd ply counts force awkward thick-thin layer splits. Their workaround was a triple-layer shell approach that groups the nine plies as 4-1-4 (a thick four-ply layer, a thin single-ply layer, and another thick four-ply layer), which they argue handles an odd number of plies more faithfully while still simulating complex behaviours like debris-wedge formation.
The validation held up well. Across all three tube types and both loading directions, model and test agreed on both energy absorption and peak force to inside 9%, the worst gap coming out at 8.7%.
Finite-Element Model vs. Physical Test
Absolute error between LS-DYNA simulation and crush testing, across all three tube types and both loading directions
Source: Table 4, Fu et al. (2025). Diagram above: original visualization by Addcomposites.
The authors are candid about the model's limits: Mat 54 leans on tuning constants with no direct physical meaning, the leftover bonding adhesive on the tilted specimens is not something the contact model reproduces cleanly, and the triple-layer method was checked only against a nine-ply build, so thicker stacks remain untested.
The honesty around Mat 54 is the part worth internalising. A validated model is not a universal one. Anyone adapting this method to a different layup, resin system, or ply count should expect to re-run their own coupon-level calibration rather than lifting these parameters wholesale.
The multi-angle result: a win that erodes as the angle grows
With the model validated, the team ran the full shape family (using the square P4 as the baseline) across all three loading angles. This is where the concave design's character comes fully into view.
Under axial load, concave tubes did what the corner-count theory predicts. More corners produced more axial splitting, and the concave profiles split even more than their regular counterparts because, now and then, one concave corner would tear along two lines at once rather than one. The result was the best axial energy absorption of the group. But the concave advantage did not survive the tilt. As the loading angle climbed, concave SEA fell faster than regular SEA, and by 15° it had dropped below the regular polygonal tubes.
The paper tracks this cleanly through the M12 tube's SEA relative to the square baseline:
M12's SEA Advantage Erodes With Angle
The concave M12 tube's energy-absorption edge over a plain square tube, tracked across the loading angle
Source: Fig. 10, Fu et al. (2025). Diagram above: original visualization by Addcomposites.
The peak crushing force told a related cautionary tale. At the intermediate 7.5° angle, the regular P8 and P12 tubes ended up about 13% and 22% below the square tube's peak force — a steeper fall than the square's own drop across the same angle (the paper's P12 example: 104.95 kN down to 51.49 kN, versus the square's 102.14 down to 65.93 kN). So adding corners is not a free lunch even on the regular side; at certain angles it can trade away force stability.
The authors' summary of the whole shape study is measured: concave designs offer a real advantage under axial and small-angle oblique loading, but at a large oblique angle neither the concave nor the regular polygonal approach beats a plain square CFRP tube on energy absorption.
Why the concave tube tips over
The most useful engineering content in the paper is the explanation of why the concave design fails obliquely, because it points straight at the fix. Sectioning the P12 and M12 models and comparing their walls, the authors found both tubes bent on one wall as expected. The difference was on the opposite wall. In the regular P12 the far wall bent only modestly and its base stayed intact and anchored. In the concave M12 the far wall bent heavily, its base slipped, and the tube collapsed.
The free-body reasoning behind this is intuitive once laid out. One wall receives enough lateral support from the resistive force of the structure to stay put. The opposite wall does not: once its already-bent neighbours can no longer brace it, the bending moment overwhelms the base, it slides, and the collapse cascades. By contrast, a square tube sheds energy by peeling apart along both loaded walls at once, and it takes far more force to bring either wall down — which is exactly why the humble square resists oblique loads so well.
FAILURE MECHANISM
Why the Concave Tube Tips Over
One wall gets lateral support and holds. The other doesn't, and the base slides.
Sectioning the P12 and M12 models: the regular tube's far wall stays anchored. The concave tube's far wall slides.
Supported wall
Bends, base holds
Anchored
Unsupported wall
Bends heavily
Neighbours can't brace it
Base SLIPS → global collapse
Root cause per authors: insufficient internal support from the re-entrant walls under an oblique load.
Root cause per authors: insufficient internal support from the re-entrant walls under an oblique load. Diagram above: original visualization by Addcomposites.
This is the sentence to keep. The concave geometry's problem is not that it fails, but where — a slipping, unsupported base. That reframes the design task from “make the whole tube stiffer” to “stop the base from sliding,” which is a far smaller and more tractable intervention.
The fix: crusher plugs that stop the slide
Having diagnosed a base-slippage problem, the authors show that fiddling with cross-section parameters alone cannot solve it. They swept wall thickness (via ply count), normalised side width, and corner radius. Thicker walls reliably raised both PCF and SEA, and a wider normalised width nudged oblique SEA up (because it pushes the profile back toward a square, which supports itself better). But across the board, axial performance stayed stubbornly ahead of oblique performance. Geometry tuning narrowed the gap; it did not close it.
The intervention that worked was a mechanical one: crusher plugs fitted at the tube base to resist tipping. The team compared four configurations — no plug, inward, outward, and combined in-outward — each 10 mm tall.
Crusher Plugs Recover the Oblique Advantage
Oblique SEA (J/g) for the M12 tube, by crusher-plug configuration
Wall buckles, tube end damaged — looks good on peak force, spoils the collapse.
+46% vs. baseline — the paper's headline result
The paper's §5.2 text states 60 J/g for the plugged tube, which conflicts with its own Fig. 15c and Conclusions (both give 87 J/g). Since 60 × 1.46 ≈ 87, we treat 60 as the untriggered baseline and 87 as the plugged result, per the paper's own figure and conclusions.
Source: Fig. 15c / Conclusions, Fu et al. (2025)
Source: Fig. 15c / Conclusions, Fu et al. (2025). Diagram above: original visualization by Addcomposites.
The behaviour split cleanly. The inward plug made the wall buckle and chewed up the tube end, pulling the peak force down in a way that looked helpful but actually spoiled the collapse. Outward and in-outward plugs kept the base intact and stable, lifting oblique SEA from about 60 J/g untriggered to roughly 87 J/g — a 46% jump, and the paper's headline result. (One caveat worth flagging: the paper's §5.2 text states the plugged tube “achieved a SEA value of 60 J/g,” which conflicts with its own Fig 15c and Conclusions, both of which give 87 J/g. Since 60 × 1.46 ≈ 87, the 60 figure is the untriggered baseline; we've gone with the figure and conclusion.)
The takeaway the authors draw is that a concave polygonal tube plus an outward or in-outward crusher plug can hold its own across the multi-angle envelope, turning a shape that was fragile off-axis into one that is competitive everywhere.
The manufacturing reality behind all of this
The paper reports the geometry and the layup — the 5 mm corner radius, the odd nine-ply wall, the finding that corner behaviour is where the energy absorption is won or lost. The manufacturing reading that follows is ours, not the authors'. In our view, these are not shapes you extrude. A concave, re-entrant cross-section with a tight corner radius and a precise nine-ply wall is a fibre-placement problem: every corner is a site where fibre must turn, conform, and stay put. The authors' own decision to model the fibre with a nine-ply layup underlines the point — ply architecture is not incidental to how these tubes fail, it is the mechanism.
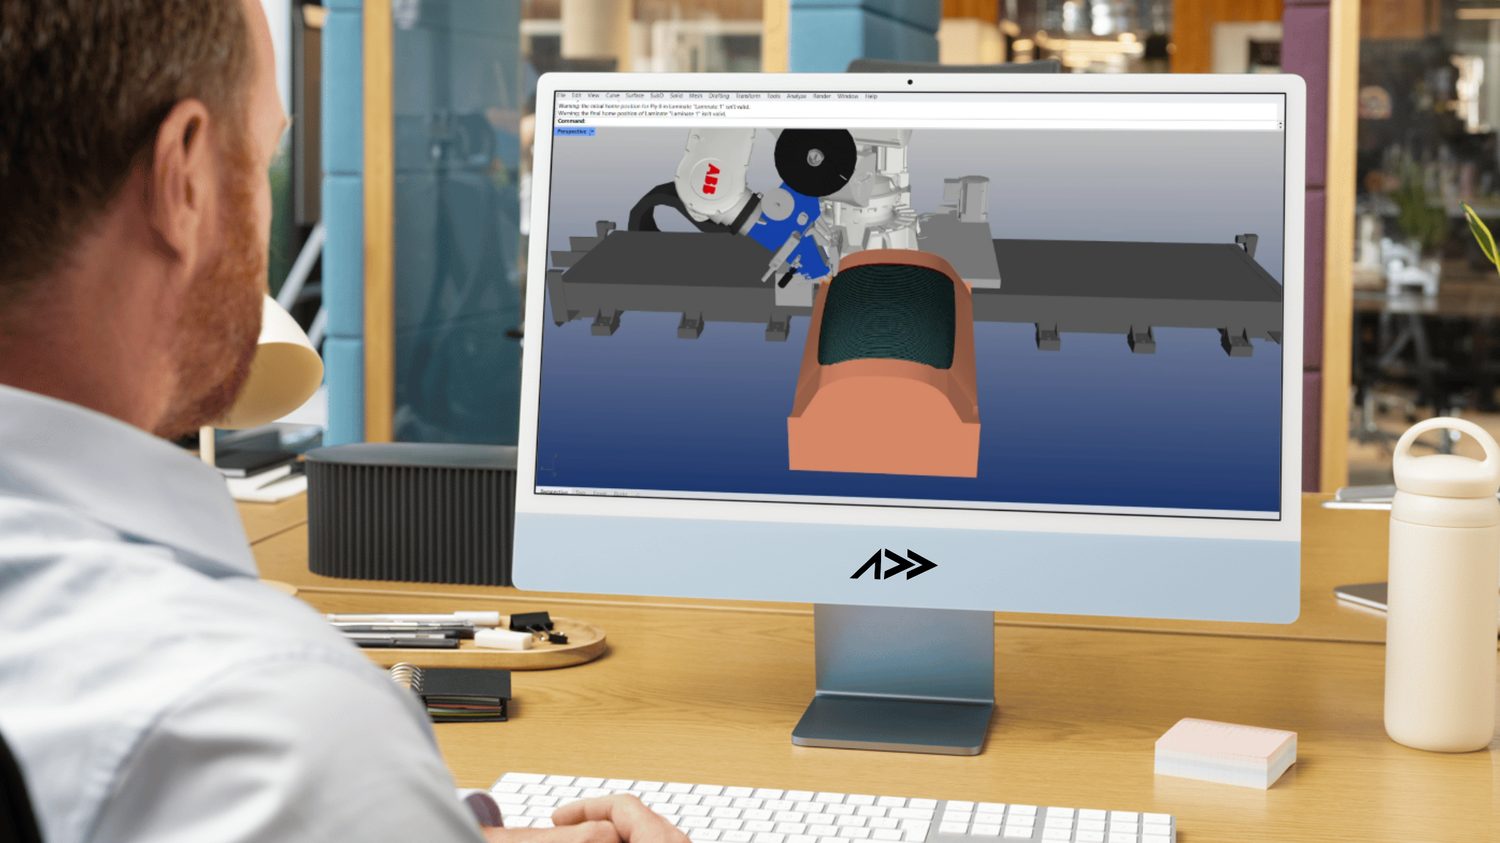
Fibre paths planned in AddPath as the AFP head lays tow over a curved composite part — the ply architecture that governs how a structure crushes.
This is squarely the kind of part automated fibre placement exists to make. A non-convex mandrel cross-section, tight corner radii, and a fibre path that has to be repeatable corner-to-corner and tube-to-tube is exactly where hand layup gets inconsistent and where AFP earns its keep. For teams building CFRP subfloor and crash structures on eVTOL and air-taxi programmes, the geometry class in this study is a natural fit for AFP-based production:
- AFP-XS suits R&D and small-to-mid-scale work — building and iterating concave crush-tube coupons, dialling in ply architecture around the corners, and running the kind of comparative shape studies this paper is built on, without committing to a large-format cell.
- AFP-X is the step up for higher-throughput, continuous production of the same complex, corner-heavy geometries — a four-tow head carrying roughly 4× the material of AFP-XS, aimed at producing these shapes at rate rather than one specimen at a time.
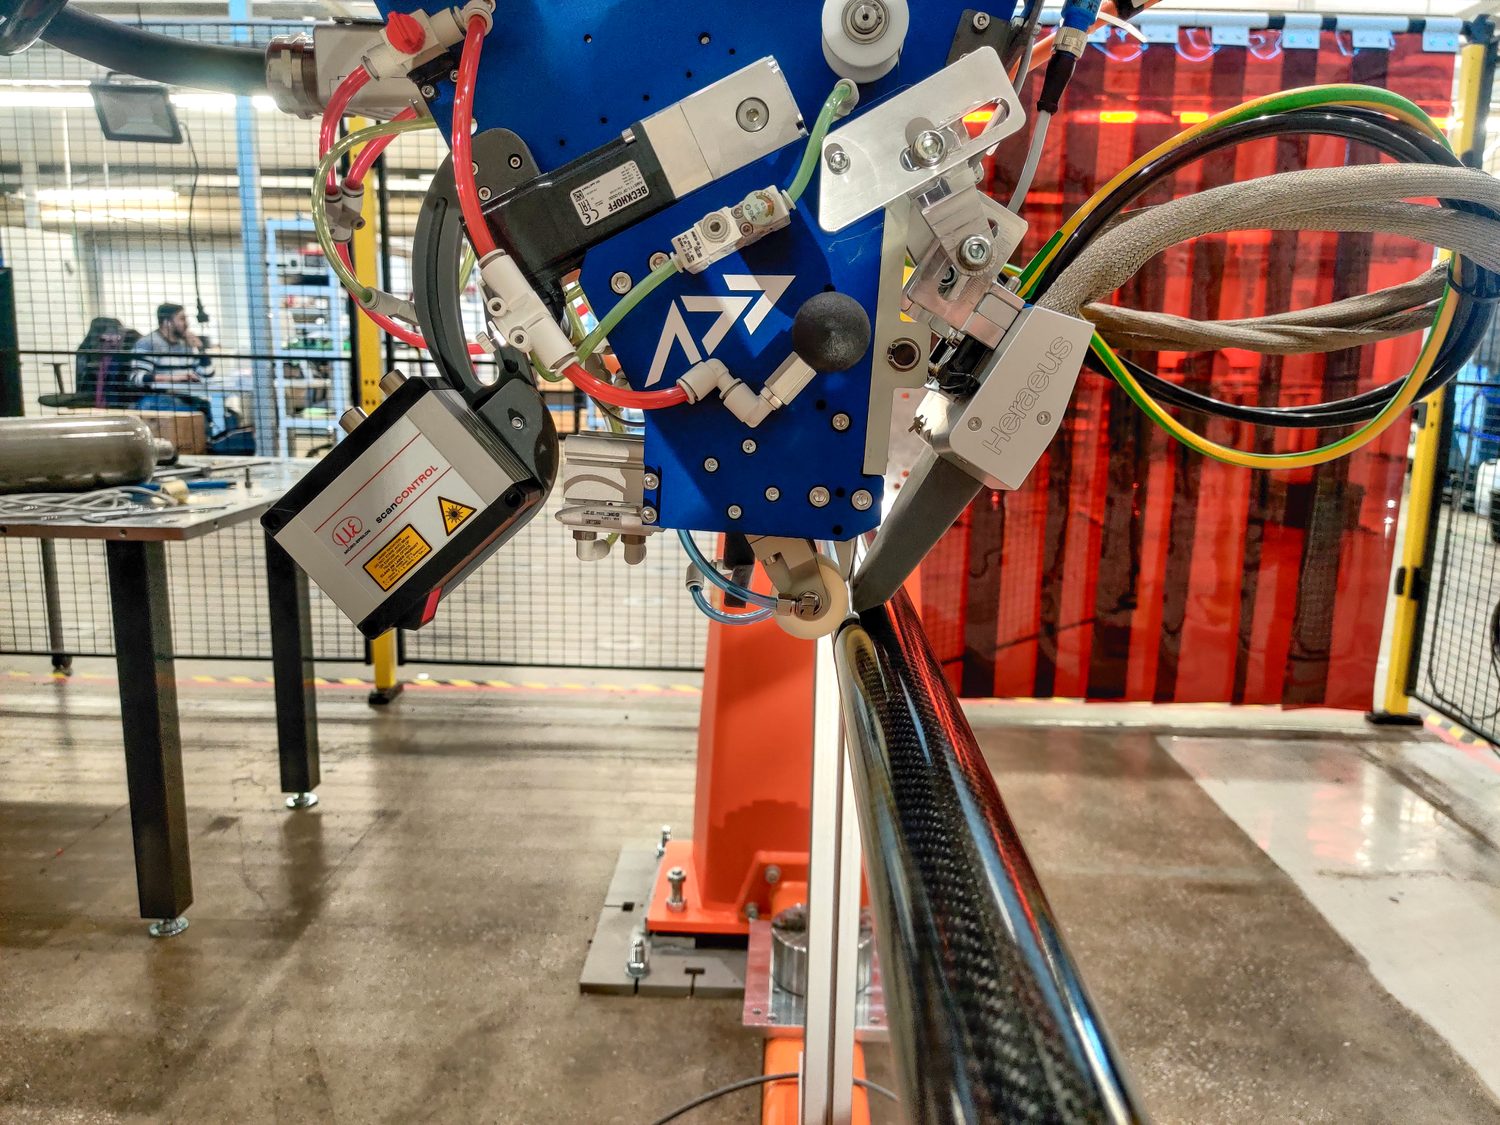
An AFP-XS head laying carbon fibre onto a tubular mandrel — placing the ply architecture that governs how a crush tube absorbs energy.
None of that is a claim the paper's authors make or endorse; it is our reading of where the manufacturing challenge and AFP capability line up. The paper's contribution is the geometry and the physics. Turning a validated crush-tube shape into a repeatable, certifiable production part is the separate problem — and it is the one precise, programmable fibre placement is built to solve.
What to actually take away
The paper's arc is refreshingly unromantic about its own idea. Concave polygonal CFRP tubes are excellent axial energy absorbers, roughly 20% better than a square tube at the M12 configuration, thanks to more numerous axial splits and fibre fracture. Left alone, they give that advantage back under oblique load because their bases slip. Add an outward or in-outward crusher plug and the weakness is largely neutralised, with stable tubes reaching 87 J/g.
For the eVTOL crashworthiness engineer working inside a shallow subfloor, that is a usable design pattern rather than a single magic shape: choose the concave geometry for its axial density, then pay the small structural tax of an anti-tipping feature to make it safe across the real range of impact angles. And because the whole thing lives or dies on how faithfully fibre is placed around those concave corners, it is as much a manufacturing question as a design one.
For teams already scoping CFRP subfloor or crash-structure programmes on eVTOL platforms, the geometry class this paper validates — concave, re-entrant cross-sections with tight corner radii and a corner-heavy nine-ply wall — is exactly the profile that separates a repeatable production part from a one-off coupon. If you're working through how to place fibre reliably around that kind of geometry, or want to talk through a comparative crush-tube study of your own, get in touch with the Addcomposites team →
Contact Us for a Consultation
Read the Research
- Fu J, Liu Q, Liu X, Zhang Y. Crashworthiness design of concave polygonal CFRP tubes for eVTOL applications under multi-angle compression loading. Defence Technology 2025, Volume 52, Pages 100–115. doi.org/10.1016/j.dt.2025.06.016. Open access under the CC BY-NC-ND 4.0 licence (creativecommons.org/licenses/by-nc-nd/4.0/). Published by KeAi Communications Co. Ltd on behalf of the China Ordnance Society.
This article is an independent editorial summary and commentary produced by Addcomposites. It is not endorsed by or affiliated with the study's authors or their institutions. No figures from the paper are reproduced; the licence does not permit their commercial reuse or adaptation. Infographics are our own visualisations of data reported in the paper, and are not reproductions of any figure from it.
